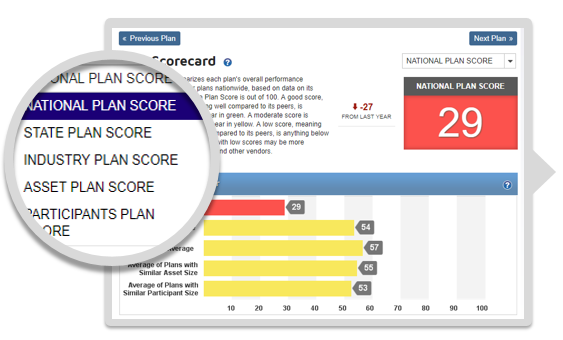
One of the most useful features unique to Retirement Plan Prospector is our Plan Scorecard. The Scorecard allows our users to get a brief overview of the plan’s performance and the areas where there might be room for improvement. The Plan Scorecard also enables you to compare the quality of a plan to another plan quickly and accurately. The overall plan score is created by ranking all the plans nationwide by seven different categories. Once the companies are rated on a percentile scale against each other in the seven different categories, we combine the seven different metrics together into one score with a proprietary weighted formula. We’ll go over the seven different categories and how to use the Plan Score to find and win new business.
The 5 Types of Plan Scores
One of the first things you’ll notice when looking at the Plan Scorecard in Retirement Plan Prospector is that there are five different scores: an Overall or National Plan Score, a State Plan Score, an Industry Plan Score, an Asset Plan Score, and a Participant Plan Score. You can use the different types of Plan Score to see how a plan really stacks up compared to other plans from companies who share the same industry, same participant totals or asset size; in short, their actual peers and the companies they compete with for new business and new talent on a day to day basis.

Rate of Return
The first category listed on the Plan Scorecard is Rate of Return. We calculate this figure by looking at the growth of assets year over year, taking into account any participant contributions or withdrawals throughout the year. While the health of the market overall largely dictates the rate of return, consistent underperformance might suggest that the current advisor is not looking over the investment lineup very closely and adjusting the lineup to provide the best options for the plan’s participants, which you can use as a talking point if you find a plan with a low rate of return score.
Participation Rate
Participation Rate is the second category listed, and it is one of the more important categories on the plan scorecard. The participation rate is calculated by taking the number of active participants divided by the total number of eligible employees. Low participation rate impacts plan performance by capping the total amount of assets invested in the plan at a lower total, which could lead to issues with highly compensated individuals being unable to contribute up to the IRS maximum allowed. That, in turn, could lead to the plan having to issue corrective distributions to the highly compensated employees who go over the limit. Low participation rate can be an indicator of the current advisor not being able to properly educate the employees at the company on the value and importance of saving for retirement.
Participant Loans
Next up is Participant Loans as a Percentage of Assets. Taking loans out of your 401(k) is highly discouraged because of the impact it has on the growth of the participant’s account. The participant loses out on all the potential earnings on the account while paying back the loan on their 401(k) account. A low score on this category can be an indicator that the plan’s participants are not properly educated on the drawbacks of taking out the loans from their 401(k)
Participant Contributions
The next two categories are closely related: Average Participant Contributions and Percent Change in Participant Contributions. Average participant contributions are calculated by dividing the total participant contributions for the year by the number of participants in the plan. This category can be tricky to glean useful information from. Professional offices with low numbers of employees like doctors, dentists and accountants will have higher average contributions than a Fortune 500 company with employees all across the socioeconomic strata. Try looking at the participant total plan score or the industry plan score to get a better idea of how the plan stacks up against its peers. The change in average participant contributions is calculated by looking at the difference in contributions from the year before and the year that the score is calculated. Negative percentages can indicate a number of things from decreasing employer matches to distrust in the current advisor causing the participants to look for alternative investment options.
Employer Contributions
The last two categories are similar to the last section we covered, but Average Employer Contributions and Percent Change in Employer Contributions examines contributions from the employer side of the plan. The average employer contributions are calculated by dividing the employer contributions by the number of participants. A low score in this category could indicate a less generous employer match. A good 401(k) plan is key to attracting and retaining talented employees, so improving a low employer contribution score is very important to both the employer and the employees.
Penalties
In addition to the categories mentioned, penalties have a sizable impact on the overall Plan Score. Some of these penalties include issuing or having a history of issuing corrective distributions, having insufficient fidelity bond coverage and more. Having these penalties show up on the Plan Scorecard indicates poor plan management, and gives you talking points to take into your meetings with prospective clients.
