Red Flag: Bottom 10% in Employer Contributions – For Prospecting? (Yes, Really)
February 04, 2019


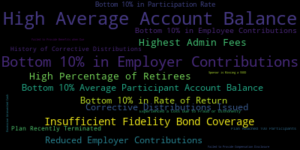
In my previous post, I introduced a data point pioneered by Judy Diamond called Red Flags.  These are the 19 proprietary flags identifying retirement plans with problems in plan design, administration or performance.  Red Flags are a hugely valuable tool.  This is especially so when searching the 5500 database to find prospects.  Advisers can use Red Flags to highlight their strengths and present their unique value proposition to sponsors.

Red Flag: Bottom 10% in Employer Contributions

In that first post on Red Flags, we explored High Average Account Balance.  It is the most widely occurring Red Flag among 401(k) plans.  In this post we will take a deeper look at the Red Flag labeled Bottom 10% in Employer Contributions.  It is the second most widely occurring Red Flag.  Together, these two Red Flags make up a little more than a third of plans having one or more Red Flags.  So, how can identifying plans in the Bottom 10% in Employer Contributions be useful for prospecting?

Sponsors offering a low or zero match for participants are generally smaller companies.  Searching the database of 401(k) plans reporting in the most recent filing year (2017), we find about 118,000 plans.  This is one of the reasons this particular Red Flag is so prevalent.  Median statistics for this group show that these are indeed small plans with the median number of participants equal to 5 and total plan assets of $216,588.

Generally speaking, smaller plans offer fewer benefits and not providing a participant match is an easy place to reduce costs.  Unless you specialize in the micro-market, this may not be the best place to focus your efforts.  But wait.  If we rank plans by plan assets, we see a different picture with many plans with hundreds of millions in plan assets.

Separating the Wheat from the Chaff

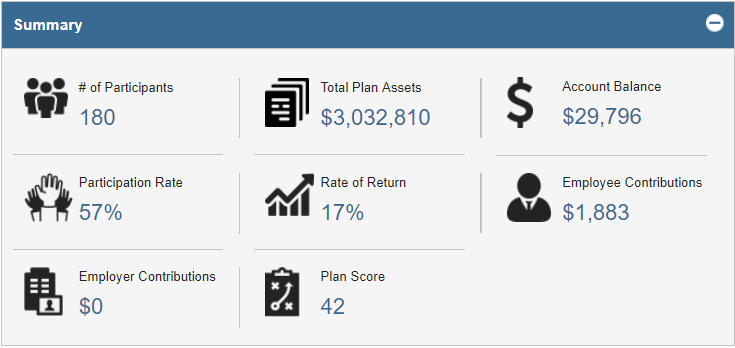
To get a better sense of what opportunities exist, let’s limit our list based on a measure of plan size.  One such measure is the number of participants.  When we do this and include only plans with 100 or more plan participants, we find 8,699 companies.  And low and behold, the median total plan assets increases to just over $3 million.  Now this is something we can work with as these larger firms will be more receptive to the benefits to be gained in employee recruitment, retention and participant outcomes.
Despite the vast number of smaller plans with the Red Flag Bottom 10% of Employer Contributions, this is still a valuable tool.  But unless your focus is micro-plans, it may be best to use this Red Flag in combination with other criteria.  One strategy is to include a measure of plan size such as total plan participants or total plan assets to find the best opportunities where sponsors may be more interested in increasing their match rate.

Posted in: Blog
 | Tags: ,
Red Flags – A Powerful Tool for Prospecting
December 24, 2018


In this post, we are going to focus on one of Judy Diamond’s proprietary data points – Red Flags and how to use them in prospecting.  Red Flags are an innovation pioneered by JDA based on 30 years of experience with the Form 5500.  The idea behind Red Flags is to identify retirement plans that have a noteworthy characteristic that is not entirely obvious.  While many of the Red Flags point to potential problems, whether it be with performance, plan design or administration, this is not always the case.

There are nineteen Red Flags identified as important relative to prospecting.  Over the coming months, we will focus on one or more of these flags to provide a more detailed explanation along with some tips on how to use them in your practice.  For a complete list of the 19 Red Flags, click here.

The first Red Flag we will consider is High Average Account Balance.

Most Frequently Occurring Red Flags

High Average Account Balance

High Average Account Balance is the most widely occurring Red Flag showing up in 401(k) plans.  This accounts for nearly 200,000 plans in the 2017 plan year.  This is not surprising considering the median number of participants (10) and the median participation rate (100%) for plans with this flag.  So what is going on here and is it good or bad when focusing on prospecting?

High Average Account Balance is an example of a Red Flag that can be considered a positive screen.   This Red Flag helps to find plans with few participants and participants with a higher than average 401(k) balance.  The average 401(k) balance is $106,000 according to USA Today.  Plans tagged with High Average Account Balance in the JDA Retirement Plan Prospector database have a median account balance of $182,778 – a staggering $77,000 more.

What Types of Plans Have this Red Flag?

What types of firms make up these plans?  Physicians, Lawyers, Dentists, Financial Advisers, and other professional services firms comprise the majority of these plans.  This includes wealthy professionals with small group practices or partnerships that are able to save the maximum in their retirement accounts.

Knowing how to find these types of plans can be helpful in two ways.  First, the business owners and participants are one and the same with these plans. As a result, it is much easier to get their attention regarding plan design or performance issues.  Therefore, whether it is high fees, poor fund selection or performance, you should be able to make a strong case to one of the business owners that it is in their best interest to meet with you.  Secondly, these companies and individual participants are not only valuable retirement prospects but can also be targeted for wealth management services.  As a result, since there are so many plans with this flag, it is relatively easy to find them in most geographic locations.

In future posts, we will take a look at some of the other most prevalent Red Flags.  These include Bottom 10% in Employer Contributions and Insufficient Fidelity Bond Coverage.

Posted in: Blog
 | Tags: , ,